This BBC article about traffic congestion in Sao Paulo carries on like 180km traffic jams are an inescapable fact of life there and congestion is an insoluble problem. They even find a professor of engineering and transport from a Sao Paulo uni to say that "No city in the world will ever manage to end congestion".
Completely ending traffic congestion may be very difficult, but there are certainly cities who have reduced it substantially by doing things which Sao Paulo has chosen not to do. Congestion charging in Stockholm, Singapore and London has sharply reduced the level of traffic in their inner cities, and there is no doubt that if they were to whack up the prices that traffic would fall even further. Many cities have also built comprehensive, high quality rail systems, and given buses priority express lanes on main roads. But in Sao Paulo, instead of a congestion charge they introduced a rotating car number-plate ban which reduced traffic in the short term but mainly encouraged people to buy more cars. The metro system is far too small given the size of the city. And historically their buses haven't been given enough priority over other traffic and so suffer from the same congestion as cars. Hence, huge traffic jams.
I'm not suggesting these are easy choices, especially for a rapidly expanding city like Sao Paulo. Most cities are not fortunate enough to have built a huge underground system over a hundred years ago when it was nice and cheap, like London did. Sao Paulo now has a growing bus rapid transit system and big plans to expand the metro, but because Brazil is a democratic country where most people have the right not to be turfed off their land, building vast infrastructure projects is much harder and slower than it is in, say, China. Likewise, it's not easy to find the money to build a subway network big enough to adequately serve a city of 20 million people, or to convince drivers that they should pay to use roads they previously used for free. Those kinds of things are very hard, which is probably why more cities don't choose to do them.
But one reason they're hard is that many people are not convinced they are worthwhile, and that in turn is partly because the public discourse around these issues seems wilfully uninformed. There are solutions available which are workable and demonstrably effective. It's one thing to consider and reject them, but to pretend they don't exist is something else altogether.
Wednesday 26 September 2012
Monday 24 September 2012
Mapping pedestrian casualties in London
The Department for Transport publish full data on recorded road casualties on data.gov.uk, and I've been playing around with the data a bit recently, partly as a way of learning some new software skills.
The map below (best viewed at full size) is one result, and shows serious and fatal pedestrian casualties in London in 2011 which were the result of collisions with bikes (in red) or cars (in turqouise). Bigger circles represent fatalities and smaller ones serious injuries.
In total there were 980 serious or fatal pedestrian casualties in London in 2011, of which 33 resulted from collisions with bikes (one fatal) and 609 resulted from collisions with cars (38 fatal). The remainder resulted from collisions with motorbikes, goods vehicles, buses and other vehicles, but I didn't show them as I wanted to keep it simple and was mainly interested in comparing cars and bikes.

Techie details: I downloaded the csv data for casualties, accidents and vehicle records for 2011, used R to merge and filter the data, used QGIS to convert the data to a shapefile, and used Tilemill to combine that shapefile with some other layers, apply stylings and export to PNG. Tilemill does some puzzling things like leaving some of the markers brigher than others for no apparent reason, but hopefully that will be ironed out in future versions.
Problems with comments
Apparently some comments are not appearing on the site, even though I can see them in the Blogger admin system. This seems to be a problem with Disqus not picking up comments made via the mobile version of the site. I'm trying to fix it at the moment. I think this only affects one comment so far, and it hasn't been lost.
Also, some readers have said they can't leave anonymous comments on the site. You should be able to - just post as a 'Guest' and enter a made-up email address.
Also, some readers have said they can't leave anonymous comments on the site. You should be able to - just post as a 'Guest' and enter a made-up email address.
Saturday 22 September 2012
Reviewing TfL's road safety plan, Part 2: Which target?
This is the second post looking at Transport for London's draft road safety plan, which is out for consultation here until the 28 September. Whether you agree with the draft plan or not I encourage you to respond to the consultation: 2,805 people were recorded as killed or seriously injured on London's roads in 2011 alone, so this stuff matters.
In the first post I reviewed TfL's take on recent casualty trends in London, noting that the target to halve the number of cyclists killed or seriously injured ('KSI', in the jargon) on London's roads was missed, with the number of KSI falling by just18% compared to a 57% drop in overall casualties (see chart below from the last annual report).
 TfL argued that this failure was due to the enormous growth in cycling over the same period. Which is largely true - but then why not set a target to reduce the rate of cycling casualties per trip or per kilometre cycled? As I mentioned earlier this month, TfL have recently calculated casualty rates per 100 million kilometres travelled by different modes in London, and the Department for Transport also do a similar calculation by region, so the information is available to monitor such a target. And according to the Road Danger Reduction Forum, TfL have said in the past that they intended to adopt rate-based casualty reduction targets to deal with this problem of absolute casualty targets being affected by changes in trip rates. Finally, the government's new road safety framework proposes rate-based casualty reduction targets at the national and local level (see p.72 here).
These are all good reasons to adopt a target to reduce the rate of cycling casualties per distance travelled, and similar targets for other modes. But TfL have decided against such a target; in fact they have decided against having any target of any kind to reduce cycling casualties. Instead, they propose a target to reduce the absolute number of all KSI road casualties by 40% by 2020 from the base period of 2005-09.
TfL describe this proposed target as 'challenging' (p. 26 of the plan), but when you look at their own chart it doesn't really seem all that challenging.
 The number of serious or fatal road casualties in London fell by more than half in the nine years between 2001 and 2010, and reached a low of 2,805 in 2011. TfL are proposing to reduce it to 2,176 by 2020, which would be a reduction of 22% over the next nine years, comparatively a much slower rate of reduction.
So this proposed target sounds distinctly unchallenging, even if you assume, as I think TfL must be doing, that traffic starts growing strongly again during the period. Another partial explanation is offered on the same page, when TfL say that this target "is based on the assumption that the existing road safety programme continues, but does not include the effects of any new measures". In other words, TfL aren't including the effect of any improvements from the junction review or any attempts to 'Go Dutch' in terms of cycling infrastructure. Whether that is because they don't know what to expect from these policies, or know not to expect very much, is not made clear.
All this stuff about targets might seem like fairly irrelevant bureaucracy to some, but I think it does matter, because genuinely challenging targets with a high political priority attached do in practice lead to the re-allocation of resources, and because they can help to focus minds and change cultures within bureaucracies. TfL have recently given hints that they are genuinely changing their policies and practices to reflect a new focus on reducing road danger, but this draft road safety plan and the main target proposed don't seem to reflect any of that. I think if cycling is to get significantly safer in London then we need to focus TfL's minds on reducing the casualty rate, and the road safety plan is a good place to start with that. If you agree, write to them and say so before the 28th.
In the first post I reviewed TfL's take on recent casualty trends in London, noting that the target to halve the number of cyclists killed or seriously injured ('KSI', in the jargon) on London's roads was missed, with the number of KSI falling by just18% compared to a 57% drop in overall casualties (see chart below from the last annual report).
These are all good reasons to adopt a target to reduce the rate of cycling casualties per distance travelled, and similar targets for other modes. But TfL have decided against such a target; in fact they have decided against having any target of any kind to reduce cycling casualties. Instead, they propose a target to reduce the absolute number of all KSI road casualties by 40% by 2020 from the base period of 2005-09.
TfL describe this proposed target as 'challenging' (p. 26 of the plan), but when you look at their own chart it doesn't really seem all that challenging.

So this proposed target sounds distinctly unchallenging, even if you assume, as I think TfL must be doing, that traffic starts growing strongly again during the period. Another partial explanation is offered on the same page, when TfL say that this target "is based on the assumption that the existing road safety programme continues, but does not include the effects of any new measures". In other words, TfL aren't including the effect of any improvements from the junction review or any attempts to 'Go Dutch' in terms of cycling infrastructure. Whether that is because they don't know what to expect from these policies, or know not to expect very much, is not made clear.
All this stuff about targets might seem like fairly irrelevant bureaucracy to some, but I think it does matter, because genuinely challenging targets with a high political priority attached do in practice lead to the re-allocation of resources, and because they can help to focus minds and change cultures within bureaucracies. TfL have recently given hints that they are genuinely changing their policies and practices to reflect a new focus on reducing road danger, but this draft road safety plan and the main target proposed don't seem to reflect any of that. I think if cycling is to get significantly safer in London then we need to focus TfL's minds on reducing the casualty rate, and the road safety plan is a good place to start with that. If you agree, write to them and say so before the 28th.
Monday 17 September 2012
Reviewing TfL's draft road safety plan
Transport for London are currently consulting on a draft new Road Safety Plan for London which sets out proposed targets and policies for the period up to 2020. The consultation period closes on 28 September and I strongly encourage everyone to respond - there is a questionnaire you can fill out to make it a bit easier.
I plan to do a few posts analysing the draft plan in detail, as it's quite an important document. This first post looks at how TfL describe recent trends in road safety in London; the next one will probably focus on the target they propose to adopt, and the last will look at some of the policies they do and don't propose to implement.
The number of road casualties, including the number involving fatal or serious injuries (crudely abbreviated in the jargon to 'KSI' for 'killed or seriously injured'), has fallen substantially in London over the last couple of decades, and TfL are rightly keen to highlight this. The headline figure is that the number of KSI casualties in 2010 was 57% lower than the average figure for 1994-98, which has been used as the baseline until now. This means that the overall target in the original London Road Safety Plan (first published in 2001 and then updated with tougher targets in 2005), for a 50% reduction in KSI casualties by 2010, was met.
But that first Road Safety Plan didn't just set an overall target for road casualty reduction. There were targets for individual modes too, to try and ensure that casualties were reduced across the board. Following the 2005 review, these mode-specific targets were:
I'll look at some of these issues in the next post, which is about what target should be set. For now, I'd encourage everyone again to read the proposed new plan themselves and respond to the consultation.
I plan to do a few posts analysing the draft plan in detail, as it's quite an important document. This first post looks at how TfL describe recent trends in road safety in London; the next one will probably focus on the target they propose to adopt, and the last will look at some of the policies they do and don't propose to implement.
The number of road casualties, including the number involving fatal or serious injuries (crudely abbreviated in the jargon to 'KSI' for 'killed or seriously injured'), has fallen substantially in London over the last couple of decades, and TfL are rightly keen to highlight this. The headline figure is that the number of KSI casualties in 2010 was 57% lower than the average figure for 1994-98, which has been used as the baseline until now. This means that the overall target in the original London Road Safety Plan (first published in 2001 and then updated with tougher targets in 2005), for a 50% reduction in KSI casualties by 2010, was met.
But that first Road Safety Plan didn't just set an overall target for road casualty reduction. There were targets for individual modes too, to try and ensure that casualties were reduced across the board. Following the 2005 review, these mode-specific targets were:
- A 50 per cent reduction in the number of cyclists and pedestrians killed or seriously injured
- A 40 per cent reduction in the number of powered two-wheeler users killed or seriously injured
There was also a specific target to reduce the number of children killed or seriously injured by 60%.
The targets for KSI casualty reductions among cyclists and motorcyclists were not met. As the chart below (from the last annual monitoring report) shows, the number of cyclist KSI casualties fell by only 18% and the number of motorcyclist KSI casualties by 34%.
Strictly speaking, then, the original road safety strategy failed to meet its targets. TfL, however, argue that the failure to hit the targets for cyclists and motorcyclists was due to large increases in both cycling and motorcycling in London, and that the underlying casualty rate for both modes actually decreased.
I don't know much about motorcycling trends but over the longer term it is certainly true that the cycling casualty rate has fallen in London - see, for example, the chart below produced by Fullfact.org from TfL data.
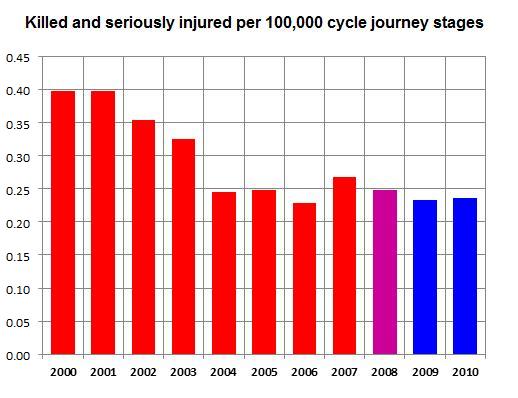
There are a few things you could say in response to this argument. The most obvious is that they can't have it both ways - TfL's target was to reduce the absolute number of cycle and motorcycle casualties, and if you go back to the 2001 road safety plan you can see that this target was set in the knowledge that use of both modes was rising. Secondly, if they now think that the rate of casualties per trip or per mile travelled is more important, then why not make that the target, or better yet set a target to reduce both the rate and the number of casualties? Thirdly, it is clear from the chart above that the cycling casualty rate pretty much flatlined between 2004 and 2010. And that trend doesn't include 2011, which saw a 22% increase in fatal or serious cycling casualties, probably outpacing the growth in cycling journeys. Again, if the cycling casualty rate is so important, isn't the record of the last several years rather worrying?I don't know much about motorcycling trends but over the longer term it is certainly true that the cycling casualty rate has fallen in London - see, for example, the chart below produced by Fullfact.org from TfL data.
I'll look at some of these issues in the next post, which is about what target should be set. For now, I'd encourage everyone again to read the proposed new plan themselves and respond to the consultation.
Tuesday 11 September 2012
More cycling than car traffic in central London during the Games?
Just a quick post speculating on a couple of interesting bits of info about transport trends in London. First, according to @bitoclass on Twitter TfL have said that cycling in London increased 22% during the Olympics (presumably compared to last year). Second, TfL have also said that vehicle traffic in central London fell considerably during the Games period, though I haven't seen any firm figures. Third, recall that even before the Games car traffic in central London was falling and bike traffic rising, with the two looking likely to converge pretty soon:

Putting these together, my guess is that cycling accounted for more journeys than cars in central London during the Games period, for the first time in probably 60 years or more. Quite a milestone if so.
[Update: Paul (@bitoclass) has kindly posted a pic of the TfL presentation slide which was the source of his factoid:

So traffic in central London was down by 5-10% in August this year compared to August 2011, and it was cycling across the Thames bridges that was up by 22%. In recent years, growth in cycling across the Thames has lagged slightly behind growth in central London (see table 8 on p.20 here) so it's quite possible that cycling in central London grew by 25% or more.
In any case, we'll probably have to wait until January or so for TfL to update the trend in my chart above. From a policy perspective, perhaps the more interesting question is whether these short-term changes in travel patterns will persist. Cycling through central London yesterday it certainly felt like the vehicle traffic was still very light, but in the absence of any more restrictions I would expect it to creep back to something close to pre-Games levels over time. Or perhaps it won't, if cycling levels stay high - after all, it does seem like once people make the leap to start cycling that a lot of them find it works for them, and in one way or another the Games have probably encouraged plenty of people to make that leap.]
Putting these together, my guess is that cycling accounted for more journeys than cars in central London during the Games period, for the first time in probably 60 years or more. Quite a milestone if so.
[Update: Paul (@bitoclass) has kindly posted a pic of the TfL presentation slide which was the source of his factoid:
So traffic in central London was down by 5-10% in August this year compared to August 2011, and it was cycling across the Thames bridges that was up by 22%. In recent years, growth in cycling across the Thames has lagged slightly behind growth in central London (see table 8 on p.20 here) so it's quite possible that cycling in central London grew by 25% or more.
In any case, we'll probably have to wait until January or so for TfL to update the trend in my chart above. From a policy perspective, perhaps the more interesting question is whether these short-term changes in travel patterns will persist. Cycling through central London yesterday it certainly felt like the vehicle traffic was still very light, but in the absence of any more restrictions I would expect it to creep back to something close to pre-Games levels over time. Or perhaps it won't, if cycling levels stay high - after all, it does seem like once people make the leap to start cycling that a lot of them find it works for them, and in one way or another the Games have probably encouraged plenty of people to make that leap.]
Monday 10 September 2012
The fatal/serious bike casualty rate per km in London is 30x that for cars; And why bikes need more space because they take up so little
TfL have published a study (under 'Research reports' here) entitled 'Levels of collision risk in Greater London' that I think only gets really interesting on the very last page. Table 4.10 on that last page includes what I think are the first TfL calculations of casualty rates per kilometre travelled in London for different modes of transport. By combining the number of casualties in 2010, estimates of total distance travelled by each mode and assumptions on the average occupancy of each mode, they come up with the following figures for the rate of fatal or serious casualties per 100 million 'passenger kilometres'.
In case you can't read the numbers, they are 73.9 for bikes, 84 for motorcyclists, 2.5 for cars and taxis, 1.0 for buses and 0.4 for goods vehicles. So some good news for our put-upon HGV drivers there. The other interesting thing (okay, maybe only to me) in that table are the TfL estimates for average occupancy of different modes. They say the average car has 1.2 occupants, the average bus 16.6, the average bike just 1 (what, no backies?). Bear in mind that TfL already assume (table 1 on p. 67 of this PDF) that on average a bike takes up just 20% of the road space that a car does (in technical terms it has a 'PCU' or Passenger Car Unit of 0.2), a bus takes up twice as much, and so on. Put these two sets of numbers together and you get a figure for 'Persons per PCU', which is basically a measure of how efficiently each mode of transport uses road space.
In case you can't read the numbers, they are 73.9 for bikes, 84 for motorcyclists, 2.5 for cars and taxis, 1.0 for buses and 0.4 for goods vehicles. So some good news for our put-upon HGV drivers there. The other interesting thing (okay, maybe only to me) in that table are the TfL estimates for average occupancy of different modes. They say the average car has 1.2 occupants, the average bus 16.6, the average bike just 1 (what, no backies?). Bear in mind that TfL already assume (table 1 on p. 67 of this PDF) that on average a bike takes up just 20% of the road space that a car does (in technical terms it has a 'PCU' or Passenger Car Unit of 0.2), a bus takes up twice as much, and so on. Put these two sets of numbers together and you get a figure for 'Persons per PCU', which is basically a measure of how efficiently each mode of transport uses road space.
| Persons per vehicle | PCU per vehicle | Persons per PCU | |
| Cyclist | 1 | 0.2 | 5 |
| Motorbike | 1 | 0.4 | 2.5 |
| Car/taxi | 1.2 | 1 | 1.2 |
| Bus/coach | 16.6 | 2 | 8.3 |
| Goods vehicle | 1.3 | 1.65 | 0.8 |
Going by these figures, buses use the road space most efficiently (NB none of this includes energy efficiency) and cars the least efficiently (goods vehicles are there to carry goods not people so this measure has fairly limited application to them). Referring back to the figures on casualty rates, we can conclude that buses are both very safe and very space-efficient, which is great, while bicycles are very space-efficient but (relatively speaking) much less safe, which is bad. Obviously cycling could be a lot safer if London had cycling facilities like they do in Amsterdam, Copenhagen, Berlin, Stockholm and various other European cities. The high space-efficiency of cycling is, I think, just another reason that TfL should be copying what those cities have done - that is, giving bikes more space in part because they take up so little.
Monday 3 September 2012
Robocars will change everything, somehow or other
I've seen very little discussion in Britain about driverless cars (or, if you prefer, robocars), but plenty in the US (see this and this, for example). As this long article in the Economist says, the technology has come a long way in a relatively short time, and it seems inevitable that driverless cars will start grabbing sizeable market share at some point in the next ten or twenty years. As detailed in that article, the implications could be profound. Cars driven by machine promise to be significantly safer than the human-driven variety, mainly because they will have a better sense of their own surroundings and can be programmed to not take any stupid risks. In fact, some of the technology is already in use as 'driver assitance' add-ons for existing car models:
Unfortunately, that's also the reason why all shared space schemes would probably be removed as quickly as possible. Nobody in a driverless car would want to sit there like a lemon while pedestrians merrily parade past in front of it. After all, if you clear the road of everything except other driveless cars these things will be able to go very fast. Roads that feature cyclists weaving in and out of traffic will be awful for robocars, while Dutch-style segregated lanes will be just peachy. So if the technology takes off, expect to suddenly see a lot of enthusiasm for roads that completely segregate cars from bikes and pedestrians.
Expect big changes in how we relate to cars too. Taxis might become either obsolete, if everyone owns their own robocar, or universal if nobody does (they just won't have taxi drivers). After all, taxis are expensive largely because they have to transport the taxi driver around the whole time even when there are no passengers. Eliminate that fairly hefty weight and they could become economical for everyday use, so why own your own?
The technology is likely to be transformative, in other words, but it's not completely clear in which direction (I haven't even mentioned the implications for inter-city transport, which are likely to be just as huge but more predictable). Maybe we will see cities sort themselves into two camps, one of which imposes speed limits on robocars and lets cyclists and pedestrians boss them around, while the other segregates uses, punitively cracks down on jaywalking and tries to speed as many cars through their streets as possible. The strange thing about driverless cars is that they seem like they could deliver almost every urban transport utopia you care to imagine, and some of the dystopias too. [Update: Speaking of which, by popular demand (two people on Twitter) here's Johnny Cab!
Volvo already sells a popular driver-assistance option called City Safety for around $2,000, for example. It slams on the brakes if a distance-measuring laser or camera detects a vehicle or pedestrian in the car’s path. City Safety can prevent collisions completely at speeds of up to 30kph (18mph), and at higher speeds it softens the impact.The other reason that driverless cars will be safer is that many people will recoil at the very idea and demand draconian safety regulations to allow them on the street. For example, they could be programmed to drive below the prevailing speed limit on every street, and to have 'black box' devices recording camera, sensor and movement data (the Economist says the latter is already a requirement for robocars in Nevada). Combine that with software that stops the car whenever a pedestrian steps in front of it and you would have a total revolution in city transport. Currently pedestrians and cyclists are afraid of cars because we don't know if they will stop for us, so we cede the streets to them. But if you knew that a car was not going too fast and would stop for you, what's to prevent you stepping out to cross the road in front of it? This is the kind of technology that would make the fantasised, pedestrian-ruled version of 'shared space' actually a reality.
Unfortunately, that's also the reason why all shared space schemes would probably be removed as quickly as possible. Nobody in a driverless car would want to sit there like a lemon while pedestrians merrily parade past in front of it. After all, if you clear the road of everything except other driveless cars these things will be able to go very fast. Roads that feature cyclists weaving in and out of traffic will be awful for robocars, while Dutch-style segregated lanes will be just peachy. So if the technology takes off, expect to suddenly see a lot of enthusiasm for roads that completely segregate cars from bikes and pedestrians.
Expect big changes in how we relate to cars too. Taxis might become either obsolete, if everyone owns their own robocar, or universal if nobody does (they just won't have taxi drivers). After all, taxis are expensive largely because they have to transport the taxi driver around the whole time even when there are no passengers. Eliminate that fairly hefty weight and they could become economical for everyday use, so why own your own?
The technology is likely to be transformative, in other words, but it's not completely clear in which direction (I haven't even mentioned the implications for inter-city transport, which are likely to be just as huge but more predictable). Maybe we will see cities sort themselves into two camps, one of which imposes speed limits on robocars and lets cyclists and pedestrians boss them around, while the other segregates uses, punitively cracks down on jaywalking and tries to speed as many cars through their streets as possible. The strange thing about driverless cars is that they seem like they could deliver almost every urban transport utopia you care to imagine, and some of the dystopias too. [Update: Speaking of which, by popular demand (two people on Twitter) here's Johnny Cab!
The amazing fall in urban crime rates, and the downside
The Economist has an article about the sharp decline in crime in American cities since the early 1990s, noting that there is no consensus over what caused it. This disagreement isn't that surprising since so many factors may be contributing to crime at once, and since the debate also has some ideological and political significance.
But it is really worth emphasising just how large has been the drop in crime in US cities, because it's important not just on its own terms but for what it says about where our cities are headed. The longest reliable historical record of crime in US cities is probably the homicide rate in New York City, which the late Eric Monkkonen compiled for every year between 1800 and 1999. You can find his data series here. It includes not just the number of homicides but the rate per 100,000 residents, and I have updated the series to 2011 with homicide data from the NYPD and population data from Wikipedia.
I think there is good evidence for the theory that lead poisoning (from car exhaust and lead paint) had a lot to do with these trends, partly because it helps explain why crime rates fell not just in the US but across Europe too (see Kevin Drum on this subject, including relevant links). I'm sure improvements in policing helped too. But in a way what caused the fall in crime is less interesting than what knock-on effects it will have.
People understandably put a high value on safety and are willing to pay a price premium to live in low-crime areas. So you would expect the fall in urban crime levels to have contributed to higher urban house prices, and at least in the case of New York you would be right - this research estimates that falling crime rates explain about a third of the mid-1990s increase in NYC house prices.
These price rises show that people really value the safer urban environments created by lower crime. But higher housing costs may not be good news for everyone, especially tenants facing higher rents. If New York City had built a lot of new housing to cope with rising housing demand it would have been able to moderate (but probably not eliminate) these price increases and allow more people to enjoy living in a great city with falling crime rates, but instead higher demand fed straight into higher prices. It would be tragic if this pattern was repeated elsewhere and low-income people pushed out of cities just as they finally become more liveable.
Subscribe to:
Posts (Atom)